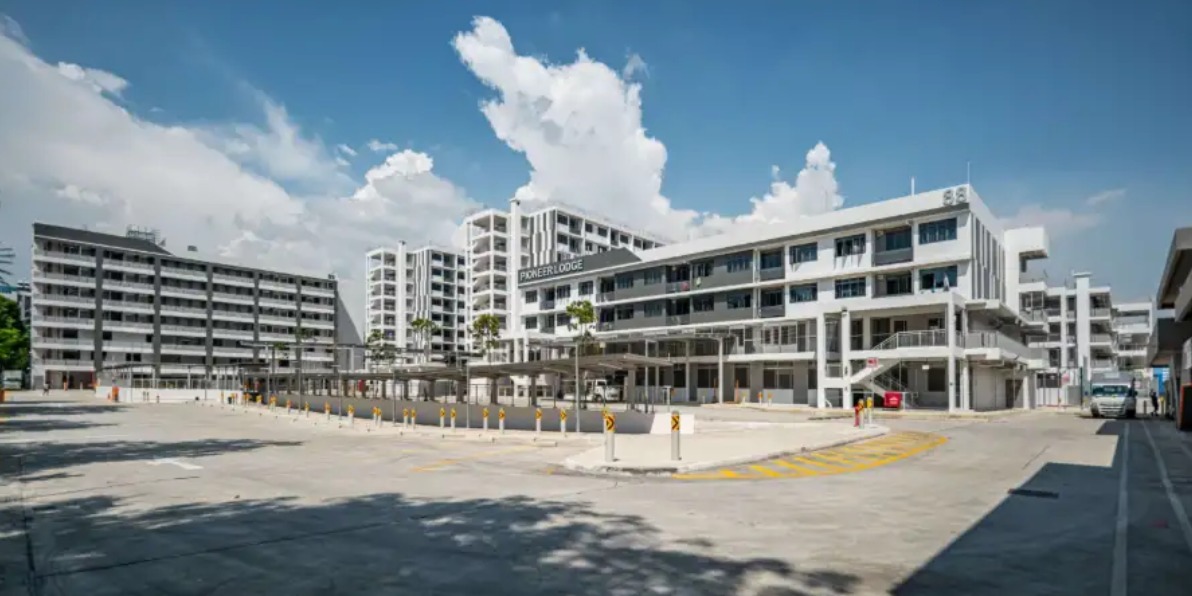
Image taken from company’s FY20 annual report.
We have previously written on Koh Brothers Group as Singapore’s construction sector was adversely affected during the pandemic. However, the price of the bonds has increased as the sector recovered and now, we turn our eyes towards Chip Eng Seng Corporation Ltd.
Chip Eng Seng draws its revenue mainly from property development, with this segment constituting 75.02% and 68.80% of total revenue in FY19 and FY20 (financial year ended 31 Dec 2021) respectively. Some of its notable residential projects in Singapore include High Park Residences at Fernvale Road, Park Colonial and Parc Komo with construction for the latter two still ongoing.
It also has subsidiaries in the construction sector, contributing 15.57% and 21.43% of total revenue in FY19 and FY20 respectively. They are usually contracted by the government, especially by Housing Development Board (“HDB”) and Land Transport Authority (“LTA”) to build public infrastructure. The remaining sources of revenue come from the hospitality, education, and property investment segment, with the latter constituting a very low percentage of total revenue.
In FY20, aggregate revenue was badly hit with the group recording its first ever annual loss since its public listing as COVID-19 halted construction and delayed progress in property development. Chip Eng Seng’s hospitality business segment also suffered as travel became non-existent. The only bright spot was the education segment due to contributions from Invictus international school (Dempsey Hill campus) and K-12 international school in Johor Bahru. However, the pandemic also delayed the licensing of proprietary education brands and completion of renovation works for new schools.
Table 1: Chip Eng Seng’s income in 2020
|
2020 (SGD m) |
2019 (SGD m) |
Change |
|
|
Construction |
144,592 |
164,405 |
-12.1% |
|
Property development |
464,169 |
791,951 |
-41.4% |
|
Hospitality |
34,634 |
78,181 |
-55.7% |
|
Education |
25,938 |
13,811 |
87.8% |
|
Property investment & others |
5,300 |
7,291 |
-27.3% |
|
Total revenue |
674,633 |
1,055,639 |
-36.1% |
|
Gross profit |
65,240 |
194,873 |
-66.5% |
|
Total (loss)/profit |
-78,490 |
32,557 |
n.m. |
|
Adjusted total (loss)/profit |
-46,710 |
33,100 |
n.m. |
Source: Company annual reports, iFAST compilations
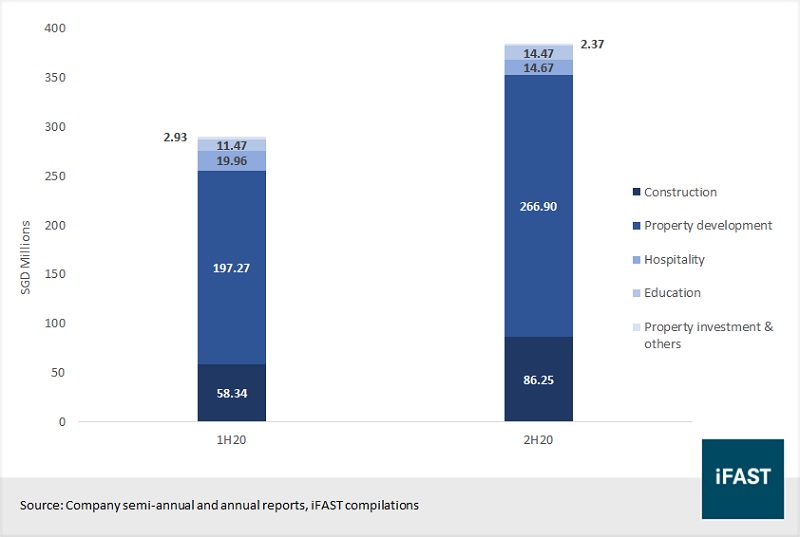
In the second half of 2020, work restrictions were lifted partially and construction resumed gradually in around October 2020 which led to an improvement in revenue for most segments, except hospitality and property investment. Thus, although Chip Eng Seng made a total loss of SGD 78.49m in FY20 (~-46.71m after adjustments), its revenue should continue to improve in 2021 as Singapore’s vaccination programme continues to progress. Increased vaccinations may allow safety measures to ease, which may speed up its construction progress.
Singapore’s property sector is also recovering strongly, similarly to global developments, as the private residential property index is estimated to have increased by 2.9% QoQ in 1Q21. This should be beneficial for its projects under construction – Parc Komo and Kopar at Newton as prices continue to improve.
However, the Singapore government may enact new cooling measures which may affect the buying sentiment of its projects in the pipeline. Fortunately, the Group is making preparations in view of possible cooling measures, and they have also stated they will remain prudent in its bids for acquisitions of land plots and development projects in their annual report.
The Group was also unable to acquire new sites last year because of limited supply from Government Land Sales and increased competition from local and foreign developers. While CES was able to save on its cash, its future revenue stream may be smaller in the future.
Figure 1: Revenue improved in 2H20
Credit profile
Chip Eng Seng has ample cash (SGD 374.04m) to cover its short-term loans. Total borrowings added to SGD 1.80b but most of them are made up of long-term debt (SGD 1.60b). With regard to the breakdown of its non-current borrowings, there are SGD 1.47b of secured bank loans due between 2022 and 2040, and SGD 125.25m of unsecured term notes due in 2022 (see Table 2).
Table 2: Breakdown of Chip Eng Seng’s debt
|
Maturity |
Secured bank loans |
Unsecured bank loans |
Term notes |
|
2021 |
183,608 |
1,000 |
13,000 |
|
2022 |
125,250 |
||
|
2025 |
4,000 |
||
|
2022-2040 |
1,470,872 |
Source: Company's annual report. Figures in SGD ‘000.
The company should have enough liquid assets to repay its debt or it may pledge some of its assets as collateral for refinancing or to raise new capital. Currently, SGD 278.26m of investment properties are secured by banking facilities and its development properties (SGD 1.09b) are subject to legal mortgages for the purpose of securing bank loans.
In a recent announcement, the company mentioned that it would be divesting its properties at 84/A/B Tanjong Pagar Road and 86/A/B Tanjong Pagar Road for ~SGD 10.7m. At the same time, its wholly-owned subsidiary, CES Capital Holdings Pte. Ltd. has been granted an option to purchase a property at 115 Geylang Road for SGD 13.5m.
For its development properties, there are three development projects under construction in Singapore – Park Colonial, Parc Komo and Kopar at Newton, and two projects in the pipeline in Australia – 28 Lyall South Perth and Northcote. As of 14 Mar 2021, the developer sold 97.4% of the units in Park Colonial, 51.4% of the number of units at Parc Komo and 47.9% of the units at Kopar. These development properties may be monetized for liquidity, as the sales of these projects can still be used to repay long-term debt.
Chip Eng Seng can also resort to divesting some of its property, plant and equipment including its land, freehold and leasehold buildings in Australia, Maldives and Singapore. The net carrying amount of hotel assets were SGD 347.12m as of 31 Dec 2020. The Group also has freehold, leasehold land and buildings, out of which a carrying amount of SGD 323.38m has been mortgaged to secure bank borrowings.
Thus, although Chip Eng Seng suffered a loss last year, its credit profile still looks strong as it still has access to sufficient liquidity to meet its short-term liabilities. Its current trade and other receivables are also more than enough to meet its current trade and other payables and other liabilities. Thus, we are not overly worried about Chip Eng Seng’s ability to meet its debt obligations.
Table 3: Liability coverage assumptions
|
SGD'000 |
|
|
Tangible assets |
|
|
Cash and short-term deposits |
~370,970 |
|
Inventories and prepayments |
8,366 |
|
Trade and other receivables |
~452,213 |
|
Contract assets |
329,211 |
|
Capitalised contract costs |
15,121 |
|
Development properties |
1,094,181 |
|
Investment properties |
~278,269 |
|
Secured PPE |
323,380 |
|
Total |
2,871,711 |
|
Liabilities |
|
|
Current loans and borrowings |
197,608 |
|
Non-current loans and borrowings |
1,600,122 |
|
Current trade and other payables |
91,890 |
|
Current other liabilities |
~180,944 |
|
Non-current trade and other payables |
159,271 |
|
Non-current other liabilities |
~133,266 |
|
Total |
2,363,101 |
Source: Company's annual report, iFAST estimates.
Relative valuation
We compare Chip Eng Seng against other local property developers and construction companies – Fragrance Group, GSH Corporation, Heeton Holdings, Koh Brothers Group and Tuan Sing Holdings. Chip Eng Seng’s bonds have the highest yields out of the bunch and with good reason – most of its credit ratios are the worst in the group.
Table 4: Credit ratios
|
Total debt/ |
Net debt/ |
Current ratio |
EBIT/Interest expense |
|
|
Chip Eng Seng |
56.2% |
174.1% |
4.6 |
N.M. |
|
Fragrance Group |
58.3% |
147.8% |
1.4 |
2.7 |
|
GSH Corp |
38.5% |
67.0% |
2.2 |
N.M. |
|
Heeton Holdings |
45.6% |
98.0% |
1.3 |
N.M. |
|
Koh Brothers Group |
44.0% |
84.4% |
1.9 |
1.4 |
|
Tuan Sing Holdings |
46.6% |
101.5% |
1.6 |
0.9 |
Source: Bloomberg Finance L.P. estimates, iFAST compilations. As at FY20.
However, for reasons explained above, Chip Eng Seng still has a strong balance sheet to meet its debt obligations or to secure its refinancing needs. Its interest coverage ratio should also improve as 1H21 revenue will be much better than 1H20 due to the relaxation of work restrictions. Thus, the Group’s bonds look good for its value.
Figure 2: Relative valuation among credits of small Singapore developers
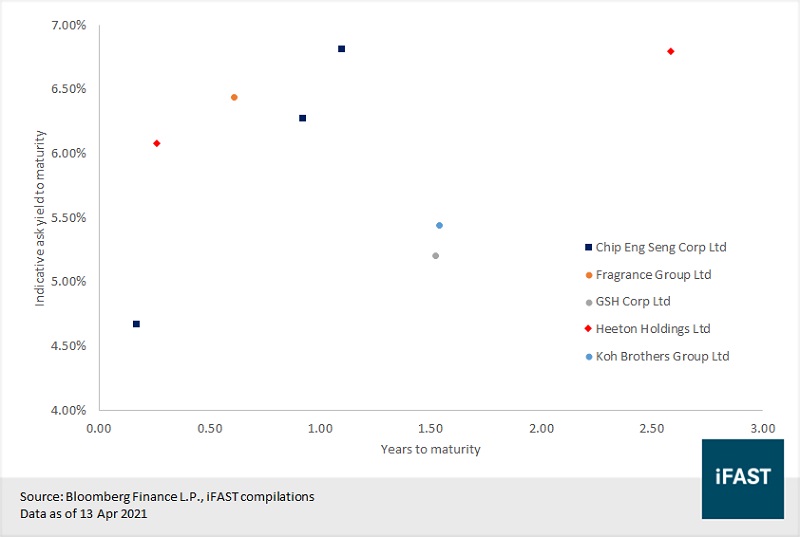
Naturally, we prefer the
higher yielding CHIPEN 4.900% 19May2022 Corp (SGD). However, we would be
indifferent between the CHIPEN 6.000% 15Mar2022 Corp (SGD) and the CHIPEN 4.9% 2022’s
if both yields are at about 6%.
As of 14 May 2021, the CHIPEN 6.000% 15Mar2022 Corp (SGD) has been included on Bond Express, where investors can get started at minimum lot sizes from just 5,000.
Declaration: For specific disclosure, at the time of publication of this report, IFPL (via its connected and associated entities) and the analyst who produced this report hold a NIL position in the abovementioned securities.